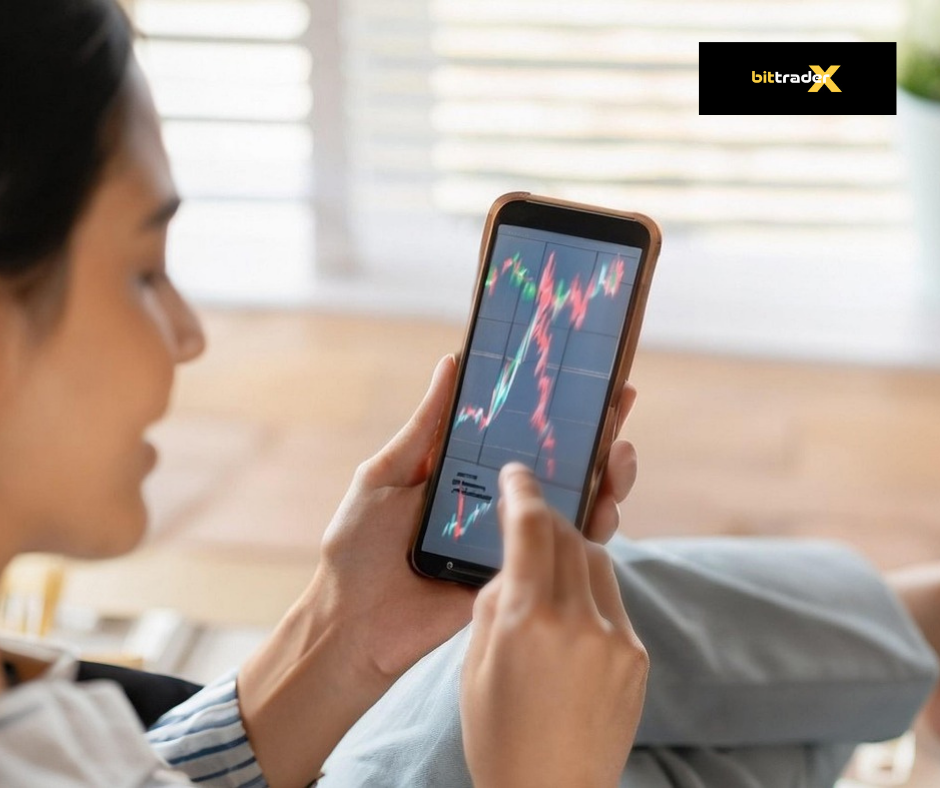
Every trading decision begins with analysis, and for most traders, charts are the starting point. Whether the goal is to identify a trend, spot a potential reversal, or manage risk more effectively, price charts provide a visual representation of market behavior that helps transform raw data into actionable insights. In the past, advanced charting tools were often available only through dedicated desktop software. Today, modern WebTrader platforms make it possible to access professional-grade analysis tools directly through a browser without installing additional programs.
The Chart as the Center of Analysis — Price, Timeframes, and Chart Types
At the core of every trading platform is the price chart. A chart displays how the value of an asset changes over time and serves as the primary tool traders use to understand market behavior. Whether analyzing currencies, commodities, indices, stocks, or cryptocurrencies, the chart provides the foundation for most trading decisions.
One of the first concepts traders encounter is the timeframe. A timeframe determines how much market activity is represented by each price bar or candle. Shorter timeframes, such as one-minute or five-minute charts, provide a detailed view of short-term price movements. Longer timeframes, such as daily or weekly charts, reveal broader market trends and long-term patterns.
Different traders use different timeframes depending on their objectives. Day traders often focus on shorter intervals because they seek opportunities within the same trading session. Swing traders may prefer four-hour or daily charts to identify trends that develop over several days or weeks.
WebTrader platforms typically allow traders to switch between timeframes instantly, making it easier to evaluate the market from multiple perspectives. A trader may identify the broader trend on a daily chart and then use a shorter timeframe to refine entry and exit decisions.
Chart type is another important consideration. Line charts provide a simple view of price direction by connecting closing prices over time. Bar charts offer more detailed information by displaying opening, high, low, and closing prices. Candlestick charts are among the most popular choices because they present the same information in a highly visual format that helps traders identify market sentiment and price patterns.
For many traders, candlestick charts become the primary analytical tool because they reveal how buyers and sellers interact during each period. Patterns such as bullish engulfing candles, pin bars, and doji formations are commonly used to evaluate market conditions and potential turning points.
The flexibility offered by modern WebTrader platforms allows traders to customize charts according to their preferences. They can zoom in on short-term movements, zoom out to view long-term trends, and compare multiple assets simultaneously from a single trading platform.
Individuals familiar with a cryptocurrency trading platform will recognize many of these features because chart-based analysis plays a similarly important role in cryptocurrency markets. Regardless of the asset being traded, charts remain the visual foundation of technical analysis.
Platforms such as bittraderx provide access to interactive charts that help traders evaluate market conditions without relying on installed software.
Technical Indicators — How They Help Identify Trend, Momentum, and Volatility
While charts show raw price data, technical indicators help traders interpret that information more efficiently. Indicators use mathematical calculations based on historical prices, volume, or other market variables to provide additional insights into market behavior.
One of the most commonly used categories of indicators focuses on trend analysis. Moving averages are a popular example. By smoothing price data over a selected period, moving averages help traders identify the overall direction of the market and reduce the impact of short-term fluctuations.
Another important category is momentum indicators. These tools attempt to measure the speed and strength of price movements. The Relative Strength Index (RSI) is one of the best-known momentum indicators and is often used to identify conditions where an asset may be overbought or oversold.
The Moving Average Convergence Divergence (MACD) indicator is another widely used tool. It helps traders evaluate trend strength and potential changes in market momentum by comparing different moving averages.
Volatility indicators provide a different perspective. Rather than focusing on direction, they help traders understand how aggressively prices are moving. Bollinger Bands are a common example. They expand and contract as volatility changes, providing insight into periods of increased or decreased market activity.
Different indicators serve different purposes, and experienced traders often combine multiple tools to create a more complete view of market conditions. For example, a trader might use moving averages to identify trend direction, RSI to evaluate momentum, and Bollinger Bands to assess volatility.
However, indicators should generally be viewed as decision-support tools rather than standalone trading systems. Because all indicators are derived from historical price data, they work best when used alongside chart analysis, risk management, and an understanding of broader market conditions.
One advantage of modern WebTrader platforms is the ability to apply indicators instantly without installing plugins or additional software. Traders can customize indicator settings, compare different analytical methods, and save preferred chart layouts for future use.
For users transitioning from a traditional crypto exchange, the availability of technical indicators within a browser-based environment often feels familiar. Many modern trading platforms emphasize accessibility while still providing sophisticated analytical capabilities.
Providers such as bittraderx integrate a variety of technical indicators into their WebTrader environments, allowing traders to analyze markets efficiently from virtually any location.
From Analysis to Decision-Making — Combining Charts, Indicators, and Risk Management
Charts and indicators provide valuable information, but successful trading requires more than simply identifying market patterns. The ultimate goal of analysis is to support decision-making, and effective decisions depend on combining multiple elements into a structured trading process.
A common mistake among beginners is relying exclusively on indicators while ignoring broader market context. Professional traders typically begin with a market assessment that considers trend direction, key support and resistance levels, market sentiment, and relevant economic events. Indicators are then used to support or refine those observations.
For example, a trader may identify an uptrend on a higher timeframe chart. Instead of entering immediately, they might wait for a pullback and use a momentum indicator to evaluate whether buying pressure is returning. This combination of chart analysis and indicator confirmation can help improve decision quality.
Risk management plays an equally important role. Even the most carefully analyzed trade can result in a loss because financial markets are inherently uncertain. For this reason, traders often determine risk parameters before entering a position.
Stop Loss orders are commonly used to limit potential losses if the market moves unexpectedly. Take Profit levels help define potential reward targets. Position sizing determines how much capital is exposed to a single trade. Together, these elements help create a structured approach to market participation.
WebTrader platforms simplify this process by integrating chart analysis, indicators, and risk management tools within a single interface. Traders can analyze a chart, place an order, define risk parameters, and monitor positions without switching between multiple applications.
This convenience is particularly valuable for traders who prioritize flexibility. Whether working from home, traveling, or monitoring markets from different devices, browser-based access allows analytical workflows to remain consistent.
Many traders who use a cryptocurrency trading platform appreciate similar functionality because it enables quick access to market data and trading tools. However, regardless of the market being traded, long-term success depends more on discipline and risk management than on any specific indicator.
Platforms such as bittraderx support this process by combining analytical tools with risk management features that help traders move from observation to action while maintaining control over potential exposure.
Conclusion
Charts are the foundation of technical analysis, providing traders with a visual representation of market behavior and helping identify trends, patterns, and potential opportunities. Combined with technical indicators, they offer valuable insights into momentum, volatility, and overall market conditions.
Modern WebTrader platforms have made these tools more accessible than ever by allowing traders to perform advanced analysis directly through a browser. Without installing software, traders can switch between timeframes, apply indicators, customize layouts, and manage positions from virtually any location.
At the same time, successful trading requires more than charts and indicators alone. Effective decision-making depends on combining technical analysis with structured risk management and a clear understanding of market context.
Providers such as bittraderx offer WebTrader solutions that bring charting tools, indicators, and trading functionality together within a single platform. Whether a trader is analyzing Forex pairs, commodities, indices, stocks, or cryptocurrencies, bittraderx provides access to the resources needed to evaluate opportunities and manage risk effectively. Through bittraderx, traders can develop analytical skills, build disciplined trading habits, and access professional-grade market tools without the need for dedicated desktop software.